AdSense Specials
Google AdSense: Review and create your own reports
In this article you will get a detailed overview of the reports available and step-by-step instructions on how to create your own reports.
I have already covered the basic 'Entire account by day' report in theBeginner's Guide - Part 2.Most of the other reports are similar in structure. The main breakdowns or measurements are:
- Estimated revenue
- Page views
- Page RPM
- Impressions
- Impressions RPM
- Active View Viewable
- Clicks
These metrics can be added or removed. Read more about this inCreate your own report
More metrics
AdSense offers a wide range of metrics and analytics in the reporting section, so you can create a report to answer almost any question. Many of these metrics can help you develop your website and track your advertising revenue in a meaningful way, even without additional analysis tools such as Google Analytics or Matomo.
Here I will discuss some important metrics for managing your AdSense account. They will give you an indication of success factors or problems with your website.
CPC - Cost-per-Click
This is the amount you earn when an ad is clicked.

The term is actually wrong because it is not a cost to you. But the abbreviation is common because it was created from the point of view of advertisers who wanted to know what a click costs them. Also, the click costs the advertiser more than you earn, because Google also gets its share.
CPC calculation: Revenue / number of clicks
This value depends heavily on which keywords are important on your site. Advertisers bid more on highly competitive 'money keywords' and therefore the CPC is also quite high. Regional differences also play a big role. For example, the CPC in the USA is much higher than in India.
It is often not possible to influence regional and content conditions. Nevertheless, it is possible to positively influence the CPC, especially by having a high 'active view' value. See also AdSense optimisation.
CTR - Click-through-Rate
The click-through rate tells you how many times your ad impressions are clicked on average.

Obviously, you want a high click-through rate because you expect high earnings. On the other hand, if your CTR is too high, it may indicate unnatural clicks, and AdSense may take protective measures.
See also:Invalid traffic
Calculating CTR: clicks / number of impressions
Therefore, it is important to design the page in such a way that the content is clearly separated from the ad and that unwanted clicks do not occur.
Coverage
Why is coverage an important metric? This value can alert you to problems with your website.

Here are some examples:
- A low coverage value could mean that you are serving too many ads on your site. AdSense may not have enough suitable ads to serve each ad request. This could also be due to the subject matter of your site.
- Another reason could be that people are leaving your site so quickly that an ad was requested but not served.
- You may also have blocked too many categories, so there are not enough suitable ads for your site.
- Sometimes AdSense reduces the number of ads because Google 'distrusts' your site's traffic. A lot of traffic from social networking sites could be a reason for this. See the "Invalid traffic" link.
Calculating coverage: ads served / requested ads times 100
In my experience, the coverage value should be around 90%. Anything lower could indicate a problem.
Page views per ad session
This value is interesting for you if you do not want to work with analysis tools such as Google Analytics, Matomo or others.

This shows you how many pages a user views during a visit and can therefore be an indication of the attractiveness of your site. A high bounce rate can also be normal if the user finds the information they are looking for immediately. It also depends on the site and the search intent. Therefore, you should interpret this value for your site.
Calculation: Average number of page views per ad session
Ad session duration
Again, Google AdSense saves you from having to use other analytics tools.

Session time is a measure of how long someone stays on a website before leaving.
Calculation: total duration of all ad sessions in seconds / number of sessions.
A high session time could mean that the site is interesting and visitors want to stay longer. A low session duration could indicate that the site has problems, such as being difficult to navigate or having uninteresting content. However, it is important to look at other metrics, such as bounce rate, to really understand the performance of the page. The same applies here: The type of website and the target audience can influence the length of the session.
This might also interest you

AdSense basic report - Entire account by day
The basic 'Entire account by day' report is the most important basis for publishers to assess the development of revenue and success of the AdSense account...
To the post AdSense basic report
Report Types
In addition to thebasic report'Entire account by day', AdSense offers a number of other reports. You can find them in the dashboard under 'Reports'. Here are a few that are important to my analysis of AdSense data.
Sites
This report is important if you have multiple sites on which you have integrated AdSense. You can compare key metrics across sites at a glance.

You can refine the values by using 'URL channels'. You can use these to report on specific directories or parts of your site identified by prefixes in the URL.
Platforms
A very important report!

It shows you the distribution of your page views and revenue by different devices:
- Smartphone/Mobile
- Desktop
- Tablet
- Others
The order is not random, as traffic from mobile devices is now leading in most areas.

If you also compare the ratio of page views to revenue, you will be able to optimise your site design and ad placement.
Countries
This report is of interest to publishers who have international sites and can measure success by country.

It also helps to increase the security of the site. For example, if you get a lot of traffic or revenue from countries that are not in your target audience, you may be dealing with invalid traffic from bots or similar. Since this puts your AdSense account at risk, you can take appropriate action against this type of traffic, such as IP blocking.
Ad units
If you work with different manual ads, you can view the results in the 'Ad units' report.

Again, you can make further decisions based on these values. The advantage of manual ads: You can place them precisely and customise them to suit your web design. The Ad Units report allows you to evaluate not only ad types, but also ad spaces if you create and use different manual ads for them.
Custom channels
If ad units are not precise enough for you, there is another way to differentiate your impressions: using 'custom channels'. You can assign ad units to custom scoring points and have them scored.

This feature is not directly accessible: Above the reports in the top right corner is the 'gear' for settings.

Continue with: Manage Custom Channels / Add a Channel.
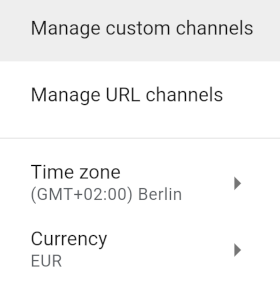
Next, select the AdSense product, which is usually 'Content'. Once you have entered a name for your channel, you can choose from the ad units you have created to be associated with it. If you only work with automated ads, you will not be able to use this reporting feature.
More report types
There are a few other ready-made reports. You might want to take a look at them and use them as a guide for which reports you are most interested in. Here are a few to choose from:
Entire account by week or month
The structure is the same as the report by days, but here with the other time periods.
URL Channel
These channels are created in a similar way to the custom channels and are useful if you want to group certain domains or sub-domains together.
Creatives
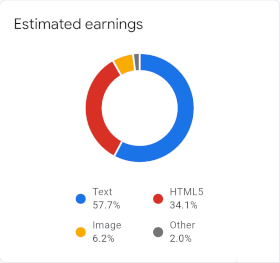
This report shows you the success of the different ad types by type, such as text, HTML5 ad, image ad, video or others.
Ad sizes
Because responsive ads are most often used for good reasons, the evaluation is often not very meaningful.
Targeting types
This gives a percentage rating between personalised, contextual and other ads.
Bid types
Typically, well over 90% of revenues are CPC (cost per click). A small proportion are CPM (cost-per-mille) ads, which are not charged per click but per impression.
Ad networks
Again, well over 90% of the ads come from our own Google Adwords network.
Top pages
Pages are only shown if a URL generates a particularly large amount of revenue.
The reporting dashboard
The reporting dashboard leaves nothing to be desired for small and medium-sized publishers.
Time range
You can define the time period for the evaluation. In addition to the pre-defined periods, you can also define your own dates using the 'Custom Periods' function.
Note: The maximum possible period is limited to three years from today's date.
Comparison
You can also compare values over time.
![]()
To do this, you can select an appropriate comparison period for the selected period, or you can mark the start and end of the periods to be compared.
Charts
Click on the graph icon to start graph selection.
![]()
Three types of charts are available for visualisation:
- Bar chart
- Pie chart
- Line Chart (Daily, Weekly or Monthly)
The ability to select a specific chart type depends on the values. Therefore, you do not always have a choice. For example, a line chart is usually used for income reports.

List of reports
Reports can be moved around the list by dragging and dropping. The top report is selected when you start the reports.
Export and schedule reports
Reports can be exported or emailed to you at a time of your choice. Start the selection by clicking on the 3 dots icon.
Exporting
You can choose from three different export formats:
- Google Spreadsheets
- Excel spreadsheet
- CSV file
You can then edit the files for your own use.
Schedule
You can also start to 'schedule' using the three points. You can set the frequency between daily, weekly or monthly, the period of the evaluation and who the report should be sent to by email. The report will then be emailed to you as a report.zip.

Create your own report in five steps - Tutorial
We have seen that many standard reports are offered in the report dashboard. They give a very good overview of most areas and are a good basis for optimisation decisions. However, sometimes you want to know something in more detail and you can create your own special reports.
In this small tutorial I will show you the main steps to create a report yourself. This will give you the tools you need to answer your questions about AdSense.
1. What would you like to know?
It is important that you are clear about what you want the report to achieve for you. The clearer your idea is, the more accurate your result can be.
Here is what we need in our example: On the 22nd of November, AdSense introduced a new ad type called 'sidebar ads'. I want to test this ad type to see how many times this new ad type is viewed and what impact it has on my earnings. For this test, I have integrated the ads into one of my webpages.
First, select a time period where you already have impressions of the new ad type! Only then will the filter later show you'Side rails ads'In other words: You can only create the report if you already have the data you are looking for.
Then start the new report by clicking the plus sign above the report selection.
2. How do we get started?
First, choose a time period where you already have impressions of the new ad type! Only then will the filter later show you 'Side rails'. In other words, you can only create the report if you already have the data you want.
Then start the new report by clicking the plus sign above the report selection.

The title is now 'Unsaved report'. We will choose the name later when we save the report. The properties are taken from 'Entire account by day'.
3. What metrics do we need?
The basic metrics are already selected and we now adjust them. We remove all metrics except 'Estimated Revenue', 'Page Views' and 'Clicks' and add 'Coverage' because we want to know how often this particular ad is viewed.

4. Set breakdowns and filters
For the breakdowns we will leave 'Date' as the base. You could also use month or week. This will give you a better aggregation of the values. If you also want to see the name of the website you are testing on in the report, add the value 'Website'.
The next step is the filter. Click on the filter icon:
![]()
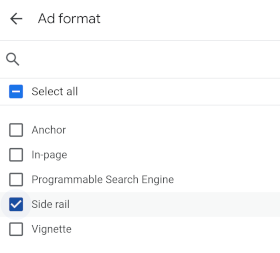
Now you may have to do a bit of fiddling to find the right value for 'Display in Side Display Strip'. I would also recommend that you take a closer look at the breakdowns, as this will give you a better feel for the evaluation possibilities. For our 'task' these three values are important:
Ad format
This is where you activate 'side rail'.
Website
This is where you activate the website where you will take the test.
Platform
At the end of this step, only the line chart 'Daily Chart' is available in the chart selection, as we have chosen the breakdown 'Date'.

You can use the report scheduling feature to have the report emailed to you on a regular basis for review and analysis.
5. Save report
The last step is to save the report under a name that suits you.
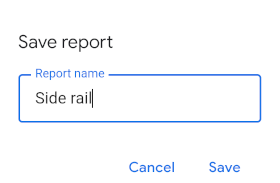
By following these five steps, you can create reports for almost any important topic in your AdSense account and receive regular email updates.
About the author


Michael Dilger-Hassel aka Milanex
Since 2011 I have been involved with all aspects of successful websites as a publisher and since 2015 I have been active in several support forums on the topic of AdSense and webmasters under the nickname 'Milanex'.
As a Google product expert 'Diamond', I have been supporting other publishers on a voluntary basis for years on all questions concerning Google AdSense.
In this blog, I take up questions from the forums and use my experience for tips and tricks. I present individual topics in detail and in depth to enable optimal use of AdSense.
To the vita
If you have any suggestions, comments or proposals for the blog post, please contact me bye-mail.I am happy to receive feedback!


 AdSense reports are essential for your account and for tracking your earnings. You can use the reports to optimise your earnings and your site, and to troubleshoot issues such as invalid traffic. In addition to the predefined reports, you can create your own reports or customise existing reports to suit your needs.

